External temperature monitoring with Linux
 I found a few DIY articles (such as here and here) that use the Dallas Semiconductor 1-Wire bus. 1-Wire is a low-speed parallel communications bus where the entire bus is powered and controlled by a single master interface. The master is usually a serial device connected to a computer. The rest of the devices can either be daisy-chained, or wired in a star topology, much the same as home phone wiring can be split from the telco demarc to multiple phones. (Despite the name, two wires are needed for a 1-Wire bus, one carries data and power, the other is ground.)
They looked nice, but I didn’t want to go the DIY route. Eventually I found iButtonLink, who makes and sells 1-Wire products. I bought the LinkUSBi master and a few T-Sense temperature probes. (The LinkUSB is a few dollars cheaper than the LinkUSBi, but the LinkUSBi also contains an ID chip, so you can verify operation of the bus even if no other devices are connected.) The iButtonLink products use RJ45 ports, so you can use Cat5 network cable to connect them together. The T-Sense probe has RJ45 ports on both ends, so you can daisy chain them if you like. I haven’t done so, but if you wanted to do star topology instead, you could buy a 4-port biscuit block with 4 RJ45 ports, and then wire all of their pin 4s together and all of their pin 5s together. Then simply plug the master into one port (doesn’t matter which, remember this is a parallel bus), and the sensors into the rest.
The products arrived Thursday, and I plugged the master into a server running Debian 5.0 Lenny. The LinkUSBi is a serial device with an internal FTDI FT232R USB UART, which was recognized by the ftdi_sio usb-serial module and set up as /dev/ttyUSB0. In case you have other ttyUSB devices on your machine, I devised this udev rule for more permanent device naming:
SUBSYSTEM=="tty", ATTRS{serial}=="?*", SYMLINK+="char/by-id/tty-$attr{serial}"
In this case it gives me /dev/char/by-id/tty-A800bZvc, but for the sake of simplicity I will continue to refer to the device as /dev/ttyUSB0 for the rest of this guide.
digitemp
Now, to read the temperatures. You’ll want the digitemp package, which is pre-packaged in Debian and probably most other Linux distributions. Once it’s installed, you’ll need to know what program to use. Several are available for different DS masters, but in the LinkUSBi’s case, you’ll want digitemp_DS9097U. To begin, verify the bus is working correctly by walking it:
# digitemp_DS9097U -w -s /dev/ttyUSB0
DigiTemp v3.5.0 Copyright 1996-2007 by Brian C. Lane
GNU Public License v2.0 - http://www.digitemp.com
Turning off all DS2409 Couplers
...
Devices on the Main LAN
28D1483C0200002F : DS18B20 Temperature Sensor
28E9393C020000C3 : DS18B20 Temperature Sensor
010EBED512000046 : DS2401/DS1990A Serial Number iButton
This shows the two DS18B20 temperature sensors (T-Sense probes), as well as the DS2401 embedded in my LinkUSBi. (The DS2401 literally does nothing but return a serial number. Still, as mentioned before it’s useful to have to verify the bus is working correctly even if no other devices are plugged into it.)
Next you’ll want to create a config file. I chose to store it in /etc/digitemp.conf.
# digitemp_DS9097U -i -c /etc/digitemp.conf -s /dev/ttyUSB0
DigiTemp v3.5.0 Copyright 1996-2007 by Brian C. Lane
GNU Public License v2.0 - http://www.digitemp.com
Turning off all DS2409 Couplers
...
Searching the 1-Wire LAN
28D1483C0200002F : DS18B20 Temperature Sensor
28E9393C020000C3 : DS18B20 Temperature Sensor
ROM #0 : 28D1483C0200002F
ROM #1 : 28E9393C020000C3
Wrote /etc/digitemp.conf
You will be left with a file called /etc/digitemp.conf that looks something like this:
TTY /dev/ttyUSB0
READ_TIME 1000
LOG_TYPE 1
LOG_FORMAT "%b %d %H:%M:%S Sensor %s C: %.2C F: %.2F"
CNT_FORMAT "%b %d %H:%M:%S Sensor %s #%n %C"
HUM_FORMAT "%b %d %H:%M:%S Sensor %s C: %.2C F: %.2F H: %h%%"
SENSORS 2
ROM 0 0x28 0xD1 0x48 0x3C 0x02 0x00 0x00 0x2F
ROM 1 0x28 0xE9 0x39 0x3C 0x02 0x00 0x00 0xC3
You can rearrange the ROM mappings as you’d like. 1-Wire refers to devices by their 64-bit IDs; the numeric mappings are for digitemp’s benefit. In my case, 28D1483C0200002F is the probe I’d like to use, so #0 is fine.
Now, let’s see what’s being returned:
# digitemp_DS9097U -q -c /etc/digitemp.conf -a
Mar 04 22:22:43 Sensor 0 C: 25.38 F: 77.67
Mar 04 22:22:44 Sensor 1 C: 27.56 F: 81.61
Great, works fine. We’ll soon need the data in a machine-readable format, so here’s how to do that:
# digitemp_DS9097U -q -c /etc/digitemp.conf -o 3 -a
0	77.79	81.50
That output is tab-delimited, the first column being elapsed time (digitemp can pull data multiple times, but we won’t be going into that so it will always be 0 here), and the rest of the columns are the probe values in order. “-o 3” is Fahrenheit; use “-o 2” for Celsius. In this case I only want the result of the first probe, so I can save some time by specifying a specific probe with “-t 0”:
# digitemp_DS9097U -q -c /etc/digitemp.conf -o 3 -t 0
0	77.90
SNMP
I want to monitor temperature using Nagios and MRTG, but in my case the 1-Wire bus is attached to a different server than the Nagios/MRTG server, so we’ll have to deal with cross-server probing. (My Nagios/MRTG server is a virtualized guest, so I placed the 1-Wire bus on the virtualization host server.) SNMP should work well for this.
First, ensure your groups are correct. The snmpd process (usually user “snmp”) will have to access /dev/ttyUSB0 (usually group “dialout”). Edit /etc/group, and add “snmp” to the “dialout” group. Also, make sure snmpd is being called with both the user AND group. In Debian, it just specifies the user and snmpd retains the effective group “root”, which doesn’t let you get at devices with group “dialout”. To fix this, edit /etc/default/snmpd and change “-u snmp” to “-u snmp -g nogroup”).
Now, create a script. I chose to create a Nagios-compatible Perl script that will also work as an snmpd “exec” process:
#!/usr/bin/perl

$warn = 82.0;
$crit = 87.0;

$output = `/usr/bin/digitemp_DS9097U -q -c /etc/digitemp.conf -t 0 -o 3`;
if($output =~ /^\d+\t([\d\.]+)/) {
  $temp0 = $1 + 0;
  if($temp0 >= $crit) {
    print "CRIT Room temperature is ${temp0}F (>= ${crit}F)|temp0=${temp0}\n";
    exit 2;
  } elsif($temp0 >= $warn) {
    print "WARN Room temperature is ${temp0}F (>= ${warn}F)|temp0=${temp0}\n";
    exit 1;
  } else {
    print "OK Room temperature is ${temp0}F|temp0=${temp0}\n";
    exit 0;
  }
} else {
  print "Cannot find probe!\n";
  exit 3;
}
And when run:
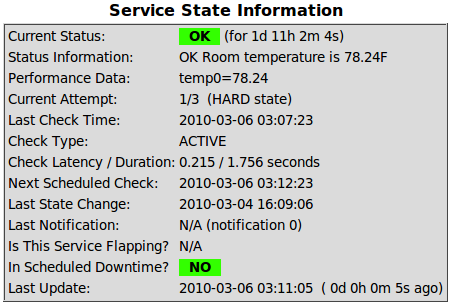
# check_roomtemp; echo $?
OK Room temperature is 78.24F|temp0=78.24
0
Now add this to your working snmpd.conf and restart snmpd:
exec roomtemp /usr/local/bin/check_roomtemp
Now switch to another host and verify it is working:
# snmpwalk -v 1 1wirehost.example.com -c community extTable
UCD-SNMP-MIB::extIndex.1 = INTEGER:
UCD-SNMP-MIB::extNames.1 = STRING: roomtemp
UCD-SNMP-MIB::extCommand.1 = STRING: /usr/local/bin/check_roomtemp
UCD-SNMP-MIB::extResult.1 = INTEGER: 0
UCD-SNMP-MIB::extOutput.1 = STRING: OK Room temperature is 78.35F|temp0=78.35
UCD-SNMP-MIB::extErrFix.1 = INTEGER: noError(0)
UCD-SNMP-MIB::extErrFixCmd.1 = STRING:
Nagios
Now, on the Nagios host, we’ll need to turn that into data Nagios can actually use. I’ve got a little script called check_snmp_exec; feed it a named “exec” entry and it will return the result and text to Nagios:
#!/bin/sh

PATH=/bin:/usr/bin:/usr/sbin:/usr/local/bin:/usr/local/sbin
USAGE="Usage: $0 [-h] -i host [-n community_string] (-x index | -e execname)"

# defaults
COMMUNITY=community

while getopts hn:i:x:e: option
        do
        case $option in
                n) COMMUNITY=$OPTARG;;
                i) HOST=$OPTARG;;
                x) INDEX=$OPTARG;;
                e) EXECNAME=$OPTARG;;
                \?|h)
                echo $USAGE
                exit 2;;
        esac
done

if [ -z "$HOST" ]; then
  echo $USAGE
  exit 2
fi

if [ -z "$INDEX" -a -z "$EXECNAME" ]; then
  echo $USAGE
  exit 2
fi
if [ -z "$INDEX" ]; then
  INDEX=$(snmpwalk -v 1 -t 5 -r 2 -Os -Oq ${HOST:?} -c ${COMMUNITY} extNames 2>&1 | while read FPART FNAME; do
    if [ "$FNAME" = "$EXECNAME" ]; then
      echo "$(echo $FPART | awk -F. '{print $2}')"
    fi
  done )
  if [ -z "$INDEX" ]; then
    echo "ERROR: Cannot find $EXECNAME on $HOST"
    exit 2
  fi
fi

snmpget -v 1 -t 5 -r 2 -Ov -Oq ${HOST:?} -c ${COMMUNITY} extOutput.${INDEX} extResult.${INDEX} 2>&1 | (read STATUSTEXT; read STATUSVAL; echo $STATUSTEXT; exit $STATUSVAL)
if [ $? -eq 0 ]; then
        exit 0
else
        exit 2
fi
Set up the check command in Nagios:
define command{
        command_name    check_snmp_exec
        command_line    /usr/lib/nagios/plugins/custom/check_snmp_exec -i $HOSTADDRESS$ -e $ARG1$ -n $ARG2$
        }
And a service check:
define service{
        use                             generic-service
        host_name                       1wirehost.example.com
        service_description             ROOMTEMP
        check_command                   check_snmp_exec!roomtemp!community
        }
Now you’re ready to monitor! Of course, if the 1-Wire master is on the Nagios host directly, you can completely skip all the previous SNMP/check_snmp_exec steps and just point your service check directly at check_roomtemp (though you would then need to make sure “nagios” was in the “dialout” group).
MRTG
I also wanted to graph the temperature, and MRTG can work for that purpose. We can use the same “roomtemp” snmp exec on the backend, but we’ll need a frontend script to extract the perfmon data to feed to MRTG. Here’s mrtg_roomtemp; it’s similar to check_snmp_exec but rewritten in Perl for its splitting capability (yes, you could do it in bash, but I’m lazy and I’m decent with Perl), and is hardcoded to this purpose:
#!/usr/bin/perl

host = "1wirehost.example.com";
$community = "community";
$execname = "roomtemp";

$result = `snmpwalk -v 1 -t 5 -r 2 -Os -Oq $host -c $community extNames`;
while($result =~ /^extNames.(\d+)\s+(.*?)$/mg) {
  $testindex = $1;
  $testname = $2;
  if($testname eq $execname) {
    $index = $testindex;
    last;
  }
}

if(!$index) {
  exit 1;
}

@result = split(/\n/, `snmpget -v 1 -t 5 -r 2 -Ov -Oq $host -c $community extOutput.$index extResult.$index`);
if($result[1] =~ /^\d+$/) {
  @result2 = split(/|/, $result[0], 2);
  if($result2[1] =~ /temp0=([\d\.]+)/) {
    print int($1 * 100) . "\n";
    print int($1 * 100) . "\n";
    print `uptime | awk '{ gsub(/,/, ""); print \$3, \$4, \$5; }'`;
    print `hostname`;
  } else {
    exit 1;
  }
} else {
  exit 1;
}
Which will return:
# mrtg_roomtemp
7845
7845
6 days 12:08
mrtghost.example.com
The temperature is multiplied by 100 because MRTG cannot handle decimal input (it was originally designed for handling SNMP interface integer counters), but we do want the extra precision so it will be converted back in the MRTG config.
Here’s the mrtg.cfg entry to handle this data:
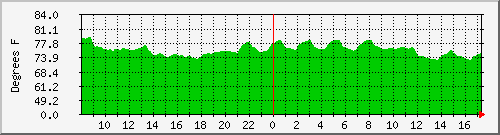
Target[roomtemp]: `/usr/local/bin/mrtg_roomtemp`
Options[roomtemp]: growright, gauge, noo, nopercent, noinfo, expscale
Factor[roomtemp]: 0.01
YTics[roomtemp]: 7
YTicsFactor[roomtemp]: 0.01
MaxBytes[roomtemp]: 20000
Title[roomtemp]: Server Closet Ambient Temperature
PageTop[roomtemp]: <h1>Server Closet Ambient Temperature</h1>
YLegend[roomtemp]: Degrees F
ShortLegend[roomtemp]: °F
Legend1[roomtemp]: Ambient Fahrenheit Temperature
LegendI[roomtemp]:  Ambient
This will produce a graph that converts the temperature back into decimal, and makes an exponentially-scaled graph (easier to see minor changes as in our case). Note that MRTG cannot handle values below zero, so if you’ll be monitoring an area that will get below 0°F (or 0°C if you decided on Celsius earlier), you’ll have to do something like convert to Kelvin:
- Change “-o 3” to “-o 2” in check_roomtemp on the 1-Wire host to change it to Celsius
- Change “int($1 * 100)” to “int($1 * 100 + 27315)” in mrtg_roomtemp on the MRTG host to convert from Celsius to Kelvin
- Change “MaxBytes[roomtemp]: 20000” to “MaxBytes[roomtemp]: 400000” in the MRTG config to account for the raised scale. (That’s from “twenty thousand” to “four hundred thousand”, there’s an extra 0 in there.)
- Change any labels in the MRTG config to reflect Kelvin.
If you need to monitor temperatures below 0K, you’ve got some rather large thermodynamic problems on your hands, though you’re probably saving a lot in cooling costs during the summer.
But seriously, here’s what the documentation says about its temperature range:
[The DS18B20] has an operating temperature range of -55°C to +125°C and is accurate to ±0.5°C over the range of -10°C to +85°C
The temperature range of the T-Sense is equal to the range of the DS18B20. The temperature range of the connecting cables will likely be far less. Standard cat5 cable sheathing will begin to melt at temperatures >60°C (140°F). High temp cables are available by special order if needed.